Blogging has taken a back seat recently due to too many exciting projects, rather than too few. One little thing I recently finished is a the Chart Sketch Toy, a tool for designing knitting charts. The project evolved from a conversation with fellow knitter and hacker, Becky, where we talked about the idea of a having a format or mark-up language for knitting patterns. Having thought about it further, I realised a GUI to convert between human-recognisable pattern display and pattern language would be a must, and in fact, the GUI would be a useful tool in its own right.
Creating knitting charts is surprisingly difficult. Knitted stitches are rectangular (well, chevron-shaped, strictly speaking) and most drawing packages work on a square grid. Dedicated knitting chart software is available, but not free, nor priced for the hobbyist market, nor browser-based. Up to this point, to sketch ideas I used an asymmetric grid generator to create a PDF of grid lines representing the stitch size I’m working with, either printed on paper or imported into PhotoShop for use with the paint bucket. And to create charts for publish I draw a lot of stitch-sized boxes in Visio. Both of these methods felt unnecessarily laborious. Many knitters resort to using software that’s totally unsuited to graphical presentation, such as excel, simply because that’s what they have available. There appeared to be a gap in the market for a simple, lightweight and widely accessible charting tool; hence the Chart Sketch Toy was born.
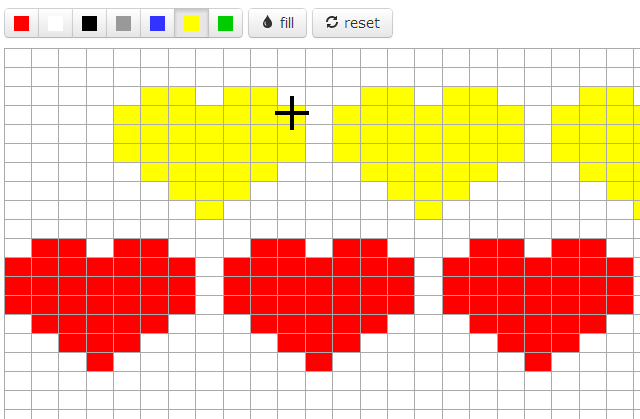
Building it was remarkably easy; a few lines of JQuery wired up to Twitter Bootstrap buttons and I had a working version in two hours.
Before investing time in extending the project I wanted to get some user feedback. It met with a very encouraging response from Twitter and the Ravelry Designers forum. There are many ways it could be extended and many features were requested; custom-sized grids, custom colour, additional stitches, export to PDF and image overlays. I’m not interested in replacing professional software for generating charts for publication or developing complex, but niche features. The most requested is the ability to save (and presumably restore), which fits any use-case and makes the case for defining that knitting mark-up language after all…